Here we will work on a limit from Multivariable Calculus class:
\[ \lim_{(x,y)\rightarrow (0,0)} \frac{(x-y)^2}{x^2+y^2}.\]
by trying the limit along several paths to see that we don't get the same
value along all paths to the origin
| (%i1) | f(x,y):=(x-y)^2/(x^2+y^2); |
What happens when we try to plug in the origin?
| (%i2) | f(0,0); |
Let's try the limit along the x axis, i.e. y=0:
| (%i3) | limit(f(x,0),x,0); |
And along the y axis, i.e. x=0
| (%i4) | limit(f(0,y),y,0); |
Now along the line y=x:
| (%i5) | limit(f(x,x),x,0); |
And we conclude the limit doesn't exist.
Let's take a look at the graph and notice the behavior
| (%i6) | wxplot3d(f(x,y),[x,-2,2],[y,-2,2]); |
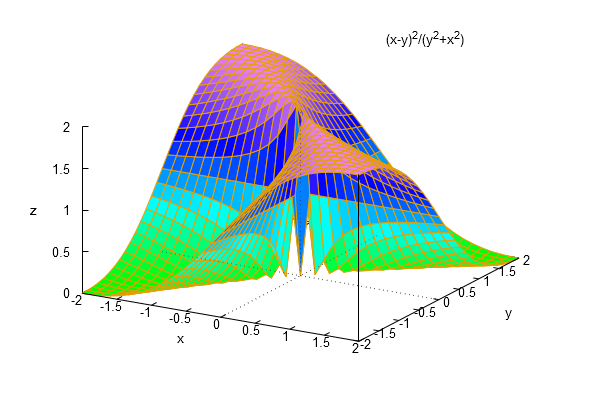
This suggests something interest also along the line y=-x:
| (%i7) | limit(f(x,-x),x,0); |